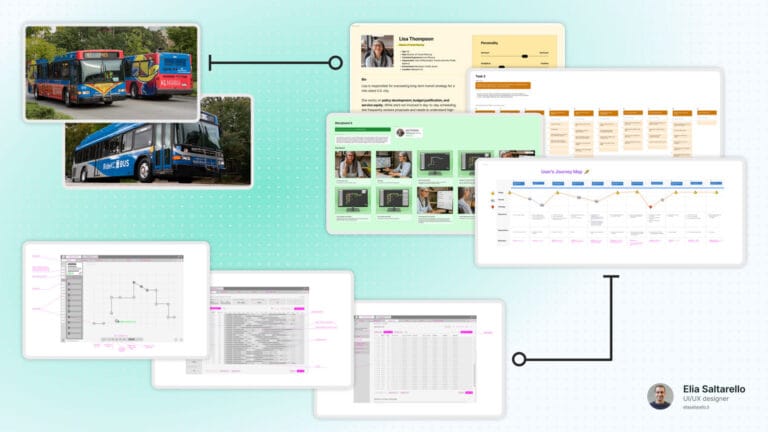
Benchmark
Below is the benchmark of competitors’ solutions (y column), divided by widgets (x column).

Initial study and low-res wireframe
By studying the previous project page, I identified the main issues and created the initial low-resolution versions of the wireframe. Through iterations with the Project Manager, I developed the first high-resolution version of the wireframes.


Team presentation
I presented the team with the results of the user research, the study of the previous version, and the outcomes of the iterations with the PM in the form of wireframes for the project page and the methodology. At this point, I asked the team for feedback on the wireframes and other aspects of the research.

High resolution wireframes development
Through feedback from the team (marketing team, developers, PM, and science team) we created a tight loop of iterations until the final wireframe was created.


Prototype
I developed the prototype in Figma, like all the other Rainbow products. The prototype in question uses:
- Rainbow ‘s Figma Design System (updated with new components using the Atomic Design principle)
- Responsive design thanks to auto layout, constraints, and grids
- The prototype can be tested with Figma preview (all animations and hover effects are fully functional)
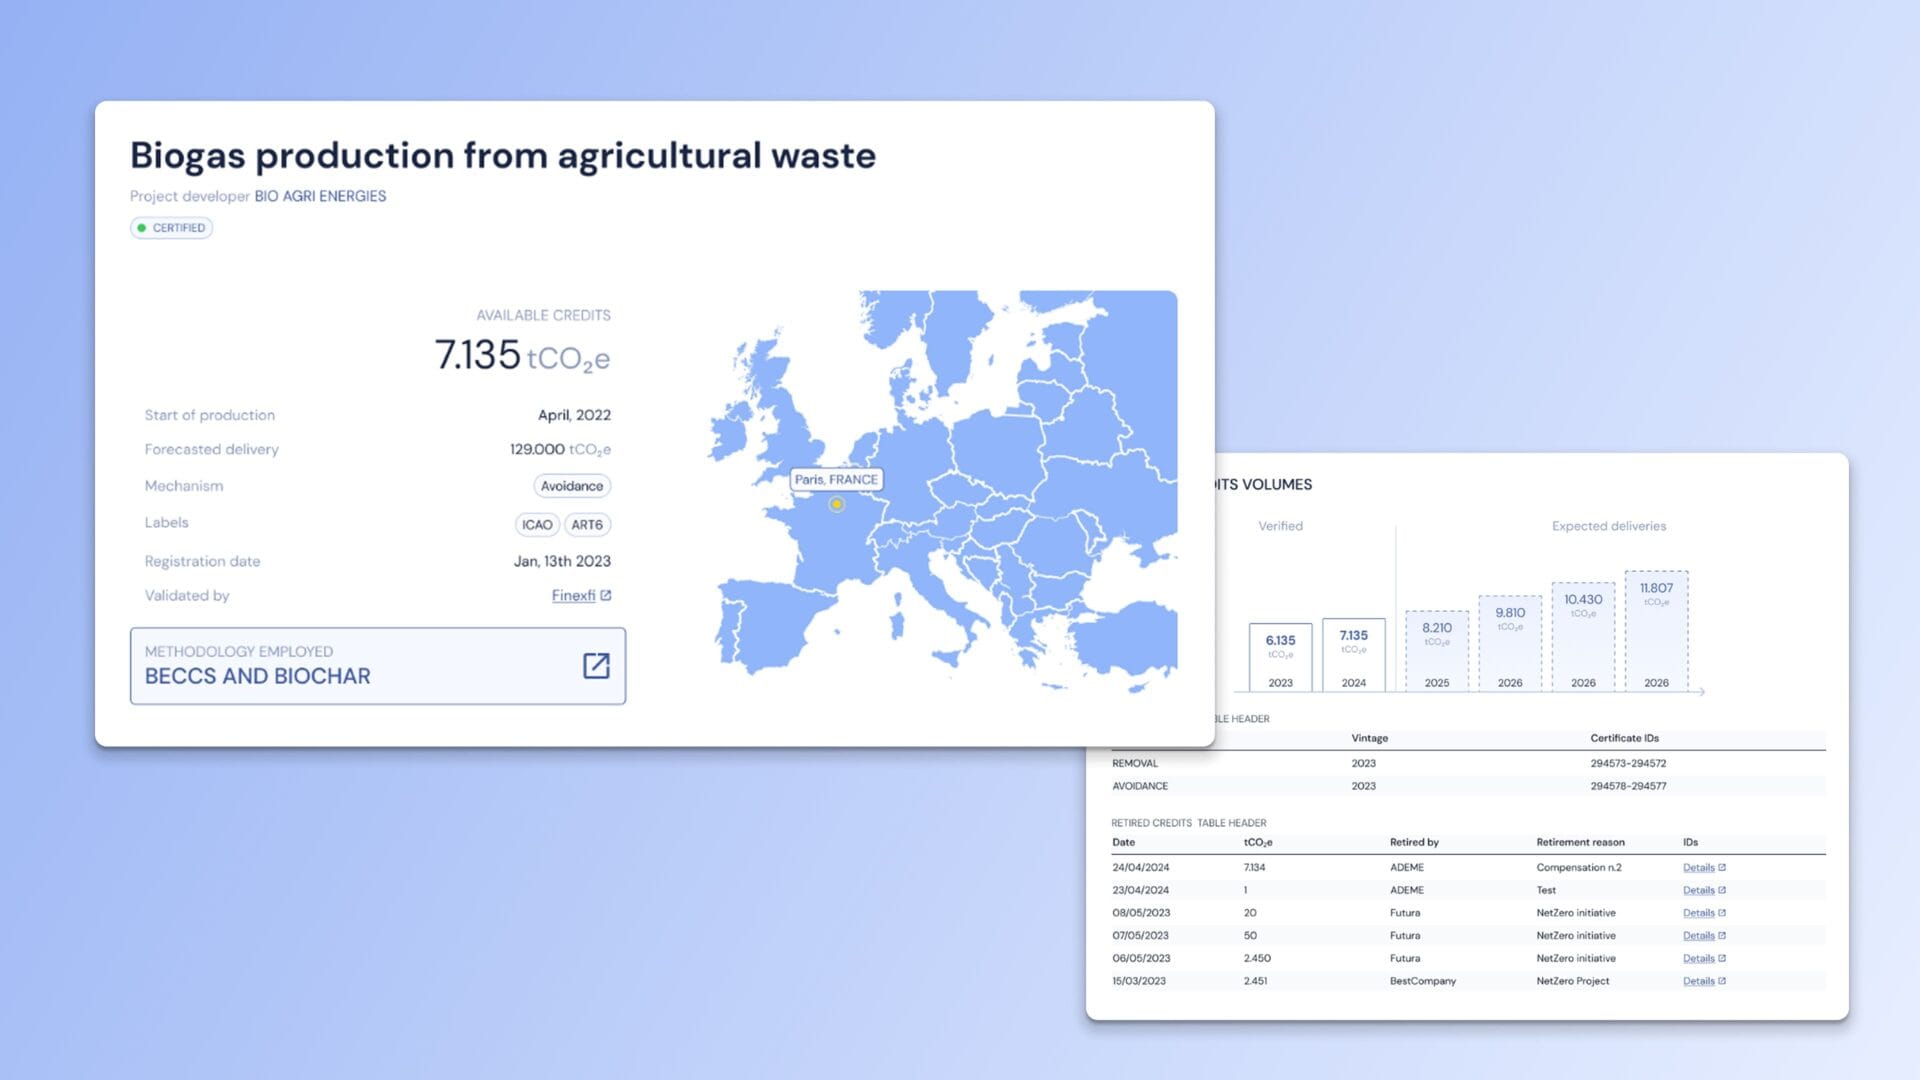
Hero section
The hero section highlights all the key information at a glance: the amount of CO₂eq avoided, the underlying reduction or removal mechanism, the independent entity validating the data, and the project’s location. The primary CTA (Buy from this project) remains constantly visible as it scrolls with the view, while the navigation bar becomes sticky to ensure persistent access to key actions. The link to the methodology page is also clearly surfaced, making it easy for users to explore the project’s technical foundations. This structure helps users quickly understand the impact, reliability, and context of the project, enabling fast and informed evaluation.